——First Prize in the “Greater Bay Area Cup” Financial Modeling Competition
Completed in collaboration with Zidong Huang and Runchen Chen
About the process
In the Greater Bay Area financial modeling competition, my primary responsibilities were the development of the time series model algorithm and the construction of the investment clock. We conducted statistical analysis based on this structure. However, our topic was asset allocation among major categories. We combined the well-known Merrill Lynch clock concept to create our own investment clock model, utilizing past data to make this investment clock more relevant in recent years. Additionally, I employed numerous mathematical methods for time series forecasting and conducted statistical analysis of the results.

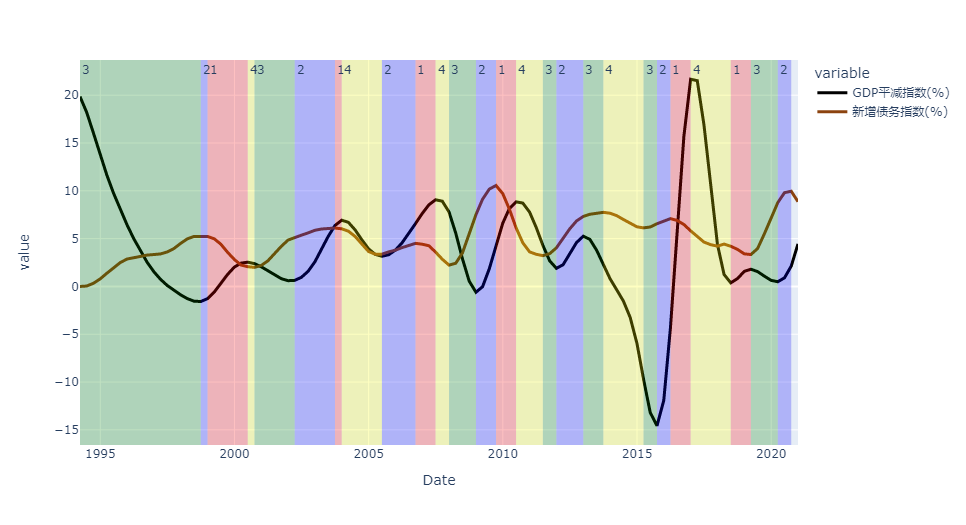
Figure: Classification of the Investment Clock Based on the GDP Debt Deflator Index and New Debt Index
Abstract
Asset allocation among major categories is of significant importance to global asset management firms, offering investors portfolios capable of effectively controlling risks. This paper focuses on segmenting economic states using macroeconomic indicators and predicts macroeconomic cycles using models. It establishes an asset allocation strategy for major asset classes based on the Savitzky-Golay filter, entropy weight method, Spearman correlation coefficient, modified investment clock, ARIMA time series analysis, and a risk parity model. The parameters are resolved using Python programming, culminating in an asset allocation strategy based on a varying-weight risk parity model.
For the first problem, we adapted the concept of the classic Merrill Lynch clock to enhance the model’s applicability. Based on original data, we modified the classic Merrill Lynch clock model, proposing the financial-economic cycle operation principle, effectively explaining China’s cyclical rules, and established a modified clock model. Then, we smoothed the curve of new debt using the Savitzky-Golay filter, normalizing the data of new debts. Finally, we used the curve of new debts and the GDP deflator index as synchronous indicators of economic-financial cycles, determining the upward or downward trends and dividing the economic cycle into four different phases, typically following the sequence from the first to the fourth phase.
For the second problem, we established an ARIMA(p,q,d) model using the indicators provided in the first question to predict the curve of new debts and the GDP deflator index. We first performed the ADF test on the model and calculated the order of differentiation. Then, we sought the best fitting equation with the least free parameters based on the Akaike Information Criterion (AIC), to find the optimal values of p and q in ARIMA. After plotting the forecast curves, we used the classification mechanism from the first question to segment the macroeconomic environment for the next five years based on the trends of the two curves.
For the third problem, we employed the entropy weight method to select four major asset class indices: CSI 1000 Index, S&P GSCI Total Return Index, China Bond Comprehensive Wealth Index, and a representative Money Market Fund. We then calculated the risk-return characteristics of the selected major asset class indices in stages, including annualized return, daily standard deviation, and Sharpe ratio. Finally, after conducting a normality test and finding the data non-normal, we used the Spearman correlation analysis, finding that bonds were strongly negatively correlated with other indices.
For the fourth problem, based on the predictions of the second problem, we selected four major asset class indices: CSI 1000, S&P Commodities, China Bond Comprehensive Wealth Index, and a representative Money Market Fund. We then established a classic risk parity model and an optimization model for asset allocation weights, finding that the final asset allocation portfolio focused on assets with smaller fluctuations, significantly reducing investment returns. Therefore, based on the principles of the risk parity model, we modified the model to distribute risk proportionally to the standard deviation of each asset’s return rate and solved the optimization model. We found that slightly increasing the risk tolerance for high-risk assets yielded relatively higher returns: Phase I annualized return 11.2%, daily standard deviation 0.016, Sharpe ratio 0.74; Phase II annualized return 8.6%, daily standard deviation 0.007, Sharpe ratio 0.63; Phase III annualized return 3.1%, daily standard deviation 0.011, Sharpe ratio 0.48; Phase IV annualized return 6.3%, daily standard deviation 0.033, Sharpe ratio 0.66.
In conclusion, this paper comprehensively analyzes how to allocate assets among major categories based on the investment clock, macroeconomic cycle prediction models, and configuration strategy models predicted. After testing and analysis, the models in this paper are found to be rational and of practical significance.
Keywords: Modified Merrill Lynch Clock, ARIMA Time Series, Spearman Correlation Coefficient, Risk Parity Model.